RGS News • 02 September 2021
“Relationship between intensity and recovery in post-stroke rehabilitation: a retrospective analysis”
Journal of Neurology, Neurosurgery & Psychiatry. Belén Rubio Ballester, Nick S Ward, Fran Brander, Martina Maier, Kate Kelly, Paul F M J Verschure.
High-intensity rehabilitation boosts recovery after stroke, suggesting that standards of care offered by many healthcare systems should be re-analysed. This work in collaboration between researchers from @SPECS_lab at IBEC and @ucl has compared results from 455 patients.
Work in animal models suggests high-intensity rehabilitation-based training that starts soon after stroke is the most effective approach to promote recovery.1 In humans, the interaction between treatment onset and intensity remains unclear.2 It has been suggested that reducing daily treatment duration below 3 hours at the acute and subacute stages leads to a poorer prognosis,3 while there may also be an upper bound beyond which high-intensity motor rehabilitation at the acute stage might lead to unwanted side effects.4 Designing optimal rehabilitation treatment programmes for stroke patients will not be possible until we understand ‘how much’, ‘when’ and ‘what’ treatment should be delivered.2 In this retrospective analysis, we assessed patients’ responsiveness to high-intensity and low-intensity rehabilitation protocols across different stages of chronicity post-stroke to address the ‘how much’ and ‘when’ questions.

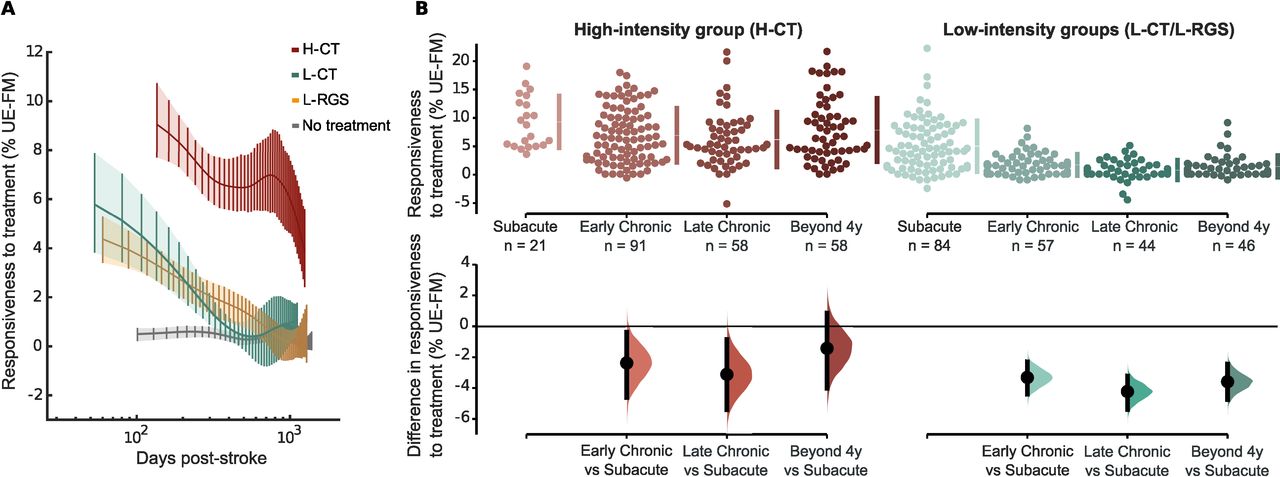
Recovery dynamics across chronicity for low- and high-intensity interventions. (A) Comparison of patients’ responsiveness to high-intensity and low-intensity treatment: high-intensity conventional treatment (H-CT), low-intensity conventional treatment (L-CT), low-intensity computer-based neurorehabilitation (L-RGS) and a no treatment group (follow-up measurement after a period of no treatment). The patient’s responsiveness to treatment is expressed by the normalised recovery rate (weekly improvement normalised by potential recovery) on the UE-FM scale,6 by the patient’s chronicity at the time of the recruitment. Solid lines indicate the estimated averages and 95% bootstrapped CIs based on the Whittaker smoothing algorithm.6 (B) (Top) Dot plot showing the distribution of normalised recovery rates to high and pooled low-intensity treatment at different stages of chronicity. (Bottom) Estimation plots indicate the effect sizes of the mean differences between the responsiveness at the subacute (horizontal line) or the responsiveness at later stages. RGS, Rehabilitation Gaming System; UE-FM, upper extremity section of the Fugl-Meyer.
